According to a report by Quantium, homewares, groceries, media, and fashion continue to dominate total spend of online retail, but the fastest growth is in takeaway food.
Share of spend
The top 4 categories – homewares, groceries, media, and fashion – account for 70% of the total amount of online spending as at June 2016.
| Category | Share of total online spend |
| Homewares (incl. appliances) | 19.9% |
| Groceries | 17.9% |
| Media (movies, books, music) | 16.5% |
| Fashion | 15.7% |
| Department stores | 9.0% |
| Personal goods | 8.5% |
| Food | 5.8% |
| Toys | 4.1% |
| Daily deals* | 2.7% |
*Daily Deals: sites that release a single product or range of products each day)
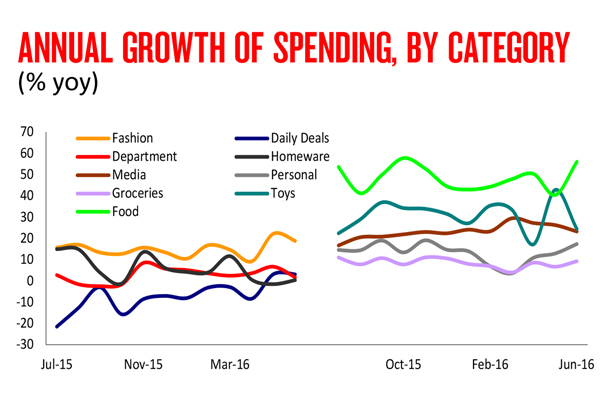
Growth rate
The online category that continues to grow at the fastest annual sales growth rate is Takeaway Food.
Though Takeaway Food only represents 5.8% of total spend, its growth was a staggering 56.1% (yoy) for the 12 months between June 2015 and June 2016.
The reasons for this dramatic surge are the new and evolving ways to order food online, such as the emergence of mobile phone applications such as Foodora, Deliveroo and UberEats which now enable consumers to have restaurant quality meals delivered to their doors by a 3rd party food delivery service.

In month on month terms, Personal and Recreational goods (3.9% mom s.a.) saw the strongest growth, followed by Homeware and Appliances (2.9%), Groceries (2.1%), Takeaway Food (1.9%). Media (-0.4%), Department stores (-2.2%), and Electronic Games and Toys contracted in the month (-3.8%).

As technology and consumer habits continue to evolve, it is expected that the share that each category comprises for online retail sales will change accordingly.